Datadog
- Pro
Datadog is a monitoring service for cloud-scale applications. It combines data from servers, databases, tools, and services to present a unified view of an entire stack. This integration allows you to configure your Postman Monitors to send metrics to Datadog where you can visualize and compare them with other metrics.
Setting up a Datadog integration requires you to get an API key from Datadog and configure your Postman Monitors. After you set up the integration, you can view real-time alerts based on the results of your monitors.
Retrieving your Datadog API Key
Log in to Datadog, and select “Integrations” in the header toolbar.
An API Key is created for you automatically under the “APIs” tab. If you want, you can also create a key by specifying a name for it.
Save the API Key to use later.

Configuring Postman Monitors
- In the Integrations page, find Datadog in the list of Postman’s 3rd party Integrations for Postman Pro users.

- Click the View Details button to see information about Datadog and how it can provide real-time alerting based on the results of your Postman monitors.
You also can click the Configured Integrations tab to set up other integrations, view available integrations for Datadog, or view all integrations.

- Click the Add Integration button to display the Send Monitor Run Results options.

- To send your monitor metrics and events to Datadog:
- Select the monitor whose data you would like to send to Datadog.
- Enter a Datadog provided API key or generate an API key.
- Optionally indicate if you want to send events for completed runs or send metrics for each run.
- Click the Add Integration button.
Viewing data in Datadog
As soon as your monitor runs, the data will start flowing into Datadog.
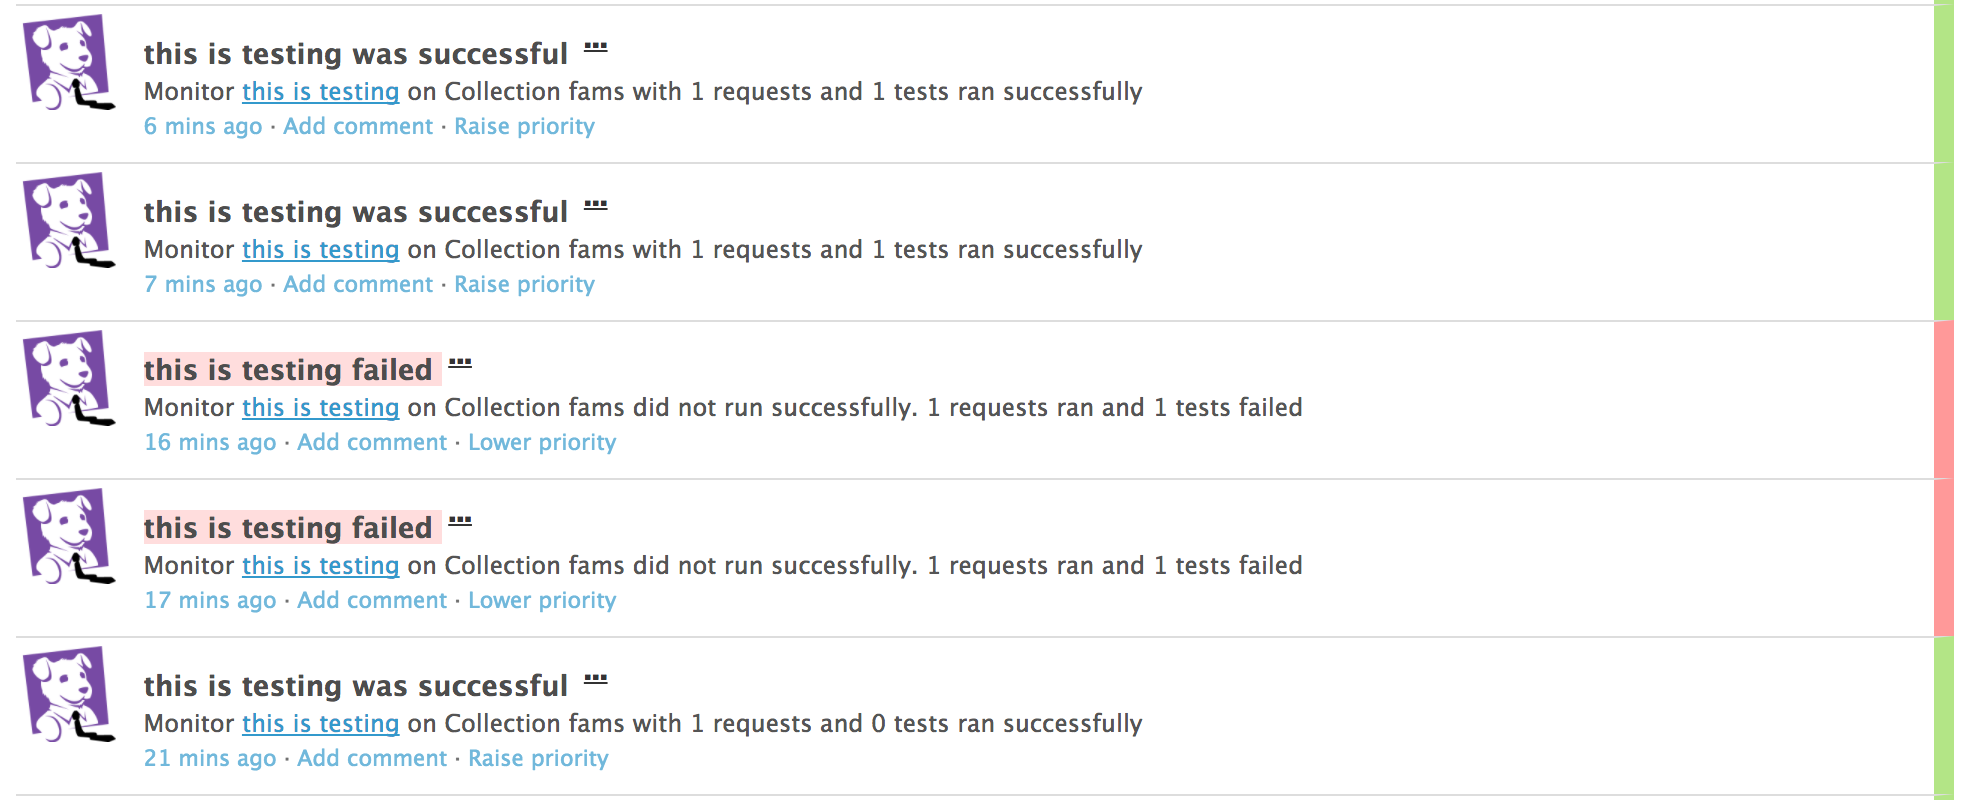
Once the data is present in Datadog, you can filter it based on the monitor name/uid, collection name/uid, user name/id, and even environment name/uid (if present). You can also combine different metrics to create a dashboard.

-
Collection runs
- Intro to collection runs
- Starting a collection run
- Using environments in collection runs
- Working with data files
- Running multiple iterations
- Building workflows
- Sharing a collection run
- Debugging a collection run
- Command line integration with Newman
- Integration with Jenkins
- Integration with Travis CI
- Newman with Docker
- Notifications
- Intro to Enterprise
- Audit logs
- Running monitors from static IPs
-
Single sign-on (SSO)
- Intro to SSO
- Configuring SSO for a team
- Logging in to an SSO team
- Configuring Microsoft AD FS with Postman SSO
- Setting a Custom SAML in Azure AD
- Setting up custom SAML in Duo
- Setting up custom SAML in GSuite
- Setting up custom SAML in Okta
- Setting up custom SAML in Onelogin
- Setting up custom SAML in Ping Identity