Setting up a monitor
Postman lets you monitor shared or private collections. If you choose to monitor a shared collection, your team can see the monitor. If you create a monitor on an unshared collection, the monitor is private and only visible to you.
You can create a monitor from the:
- Sidebar
- New button
- Launch screen
- Postman web
Sidebar
You can create a monitor for an existing collection from the sidebar.
- In the Postman app, click on the ellipses (…) next to the collection you want to monitor.
- Select "Monitor Collection".
- In the MONITOR COLLECTION modal, you must:
- Enter the name of the monitor.
- Select an environment (optional).
- Set how frequently the monitor should run. For more information on how to schedule a monitor, see the “Monitoring schedule and region” section below.
- Select one or more regions of the world from where you want to monitor your results.
You can also select advanced monitor options to receive email notifications for run failures and errors, request a timeout, request a delay, not follow redirects, and disable SSL validation.
- Click the Monitor this collection button.
New button
When you use the New button to create a monitor, Postman guides you on how to set up a monitor. The process requires you to select the requests to monitor and configures how you want to monitor the requests. Then Postman suggests steps to consider after you create the monitor.
Postman makes a collection of the URLs and adds a script that checks the response time and response code for each URL. You receive notifications when either the response code doesn’t match or the response time falls below the expected values. You can also add method, headers, and body to the individual URLs in the request builder, as well as add custom test scripts.
Here’s how to create a monitor with the New button.
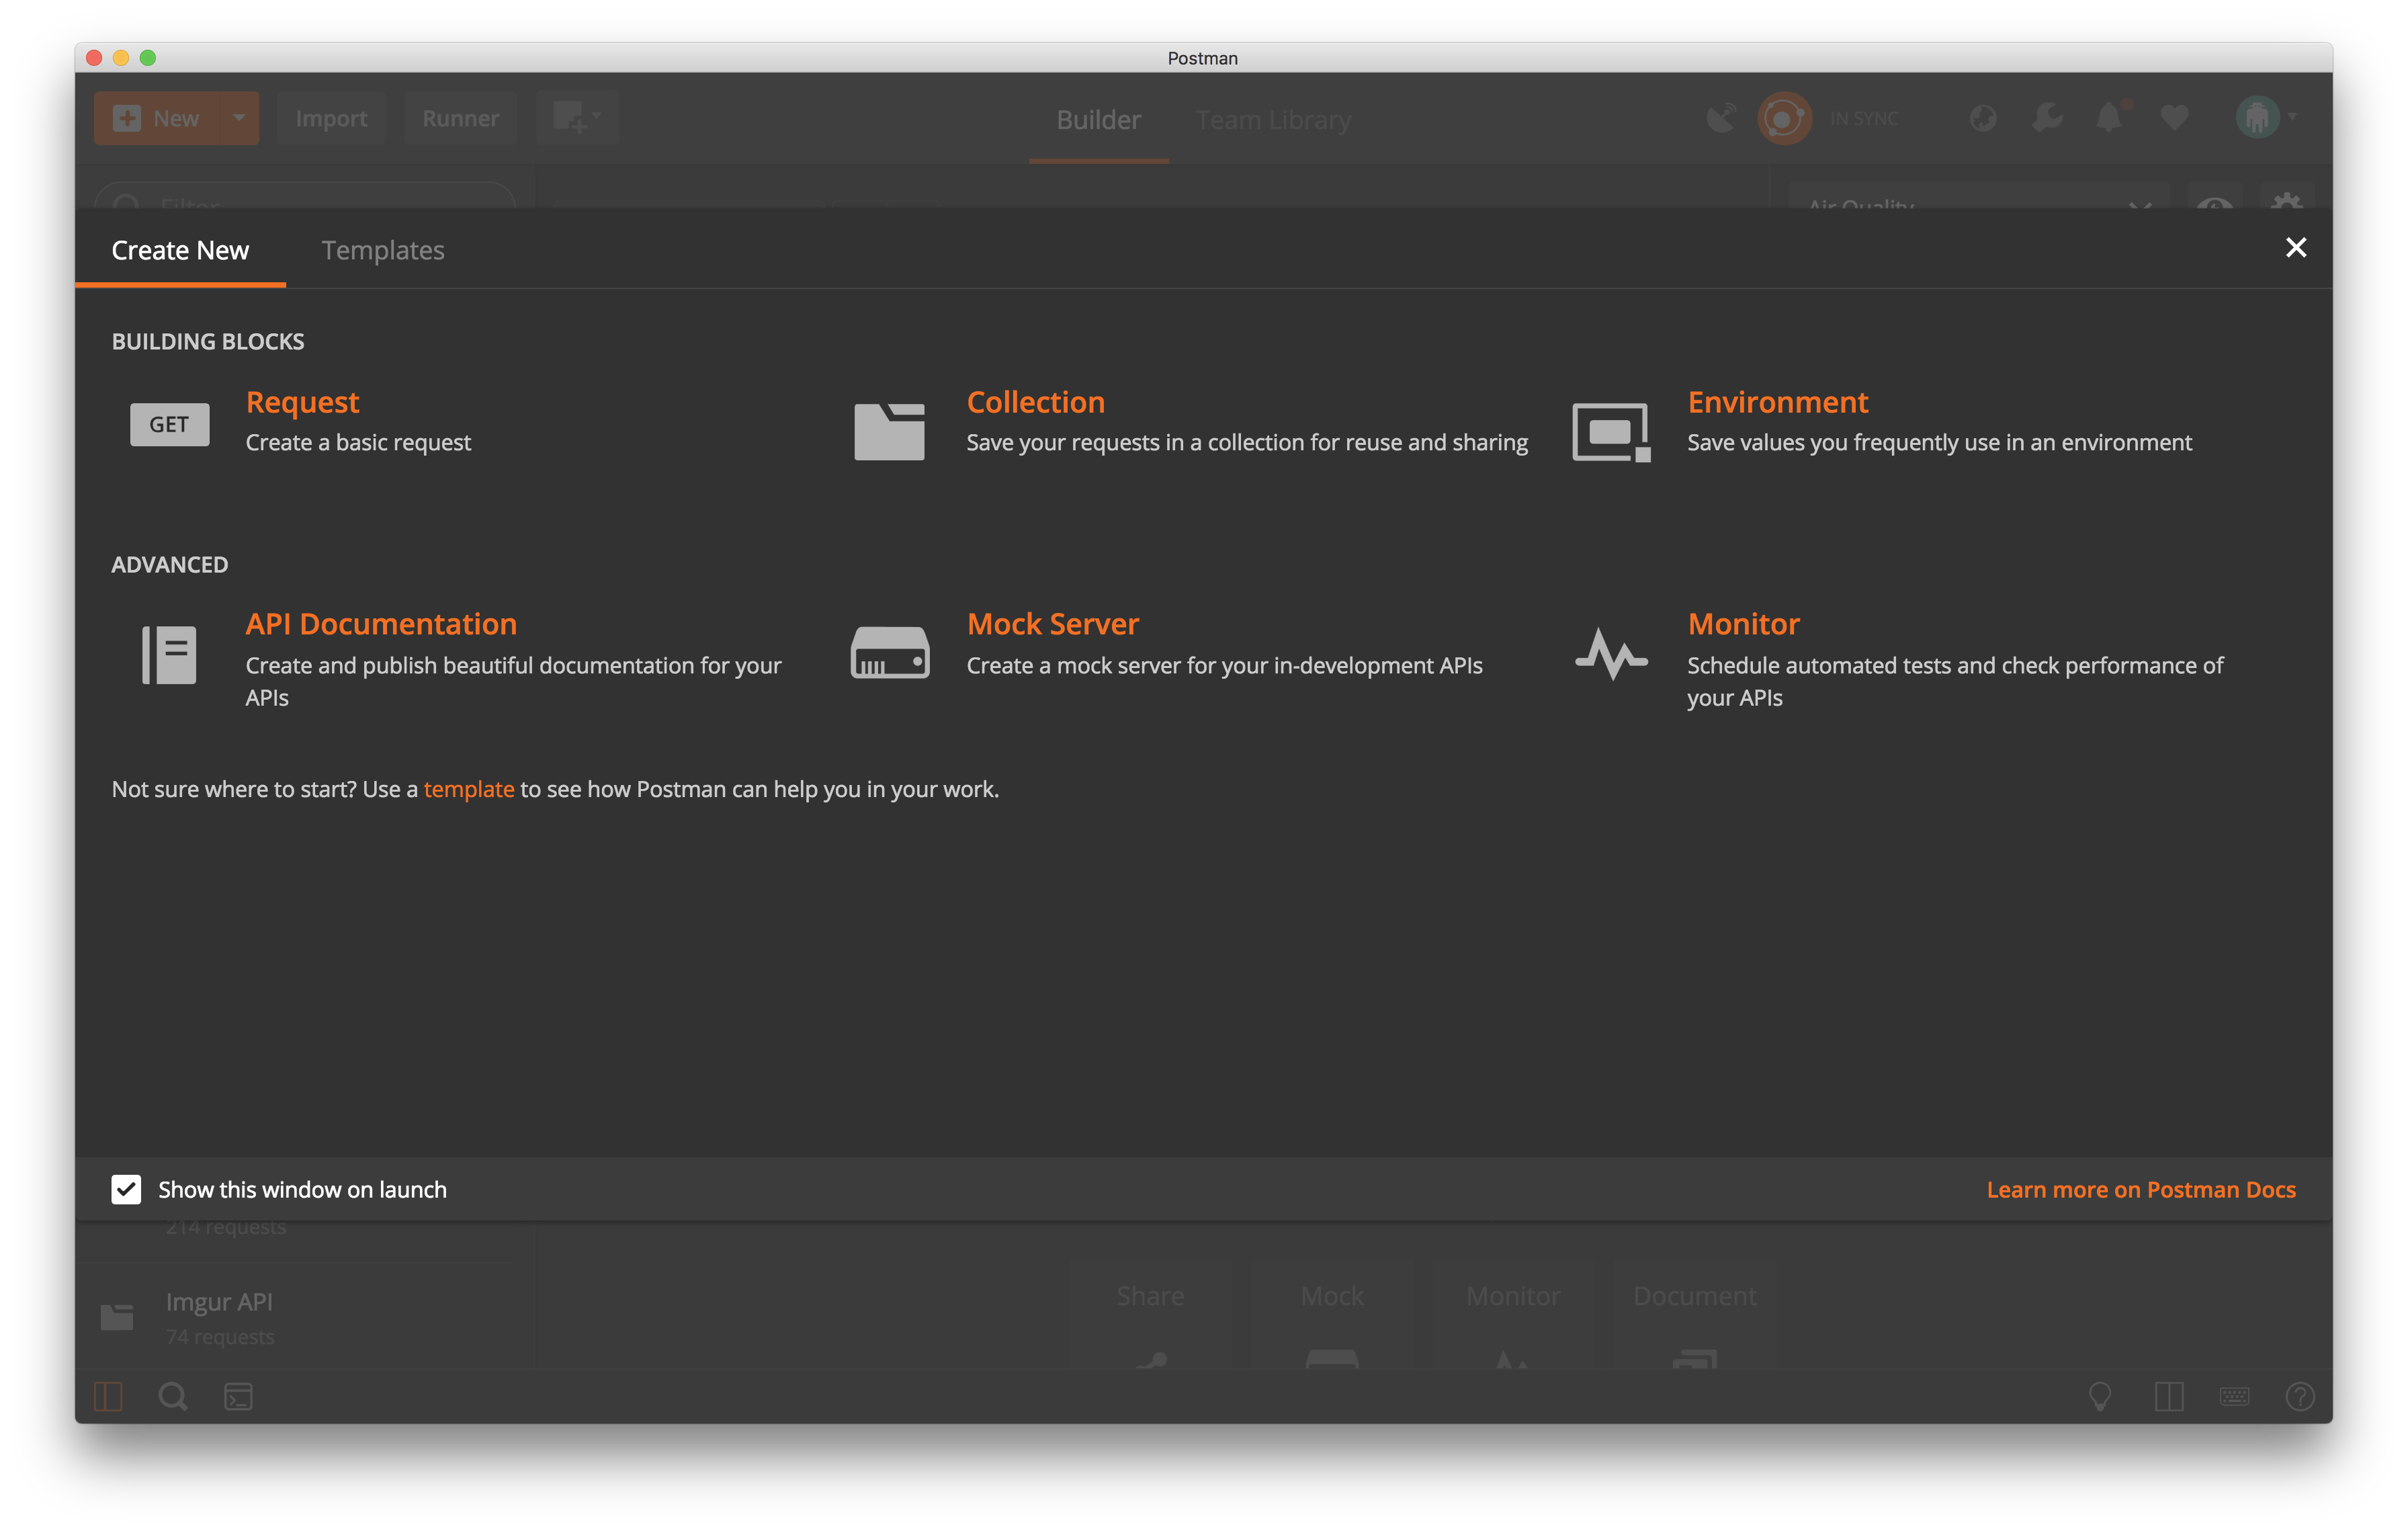
- In the header toolbar, click the New button.
The Create New tab appears.
Note: At the bottom, you can select “Show this window at launch” to indicate whether you want the Create New tab to display each time you open Postman.
- Click "Monitor".
- Select if you want to monitor a new API or an existing or team collection. If you create a new API to monitor, you must select a request method and enter the request path, response code, and response body. If you use an existing or team collection, you must select a collection from a list of existing or team collections.
- After you select or create the request you want to monitor, click the Next button.
- In the Configuration tab, you must:
- Enter the name of the monitor
- Select an environment (optional).
- Set how frequently the monitor should run. For more information on how to schedule a monitor, see the “Monitoring schedule and region” section below.
- Select one or more regions of the world from where you want to monitor your results.
- Click the Create button.
In the Next steps tab, see a list of suggested next steps to maximize the effectiveness of your monitor.
Launch screen
The Create New tab appears by default when you launch Postman.
- Open the Postman app.
- In the Create New tab, click “Monitor”.
- Follow steps 3-6 in the previous New button section.
Note: At the bottom, you can select “Show this window at launch” to indicate whether you want the Create New tab to display each time you open Postman.
Postman web
- Go to Workspaces dashboard and click “Monitors” and click the Monitor this collection button.
- In the Create Monitor modal, select a collection, schedule the frequency of the run, enter a monitor name, select the environment, and select the regions of the world from where you want to monitor your results. For more information on how to schedule a monitor, see the "Monitoring schedule and region" section below.
You can also select advanced monitor options to receive email notifications for run failures and errors, request a timeout, request a delay, not follow redirects, and disable SSL validation.
- Click the Create Monitor button.
Monitoring schedule and region
You must select the frequency of how often you want to run your monitor. Monitors can run as frequently as every 5 minutes. For example, you can run a monitor every 5 minutes or every Monday at 9:00 AM.
When you specify a monitor to run in multiple regions, the monitor will run multiple times. As a result, if there is a side effect from running the monitor, it will also happen multiple times.
Postman Enterprise users interested in setting up dedicated IPs for their API monitoring should contact help@getpostman.com.
Postman Enterprise users interested in setting up dedicated IPs for their API monitoring should contact help@getpostman.com.
Additional preferences
| Additional preferences | Description |
|---|---|
| Email notifications | Gets notifications about failures on up to 5 email addresses. |
| Request timeout | Specifies a time interval after which your request is considered to time-out. |
| Delay between requests | Adds a time lag between subsequent requests. |
| Don’t follow redirects | Disables all following redirects. |
| Disable SSL validation | Disables validations performed on SSL certificates. Check this setting if you use self-signed certificates. Use with caution! |


